Bitcoin’s price has been consolidating over the past couple of weeks following a recovery from the $56K support level. This behavior has left investors wondering whether a new record high will be witnessed in the short term.
Technical Analysis
By TradingRage
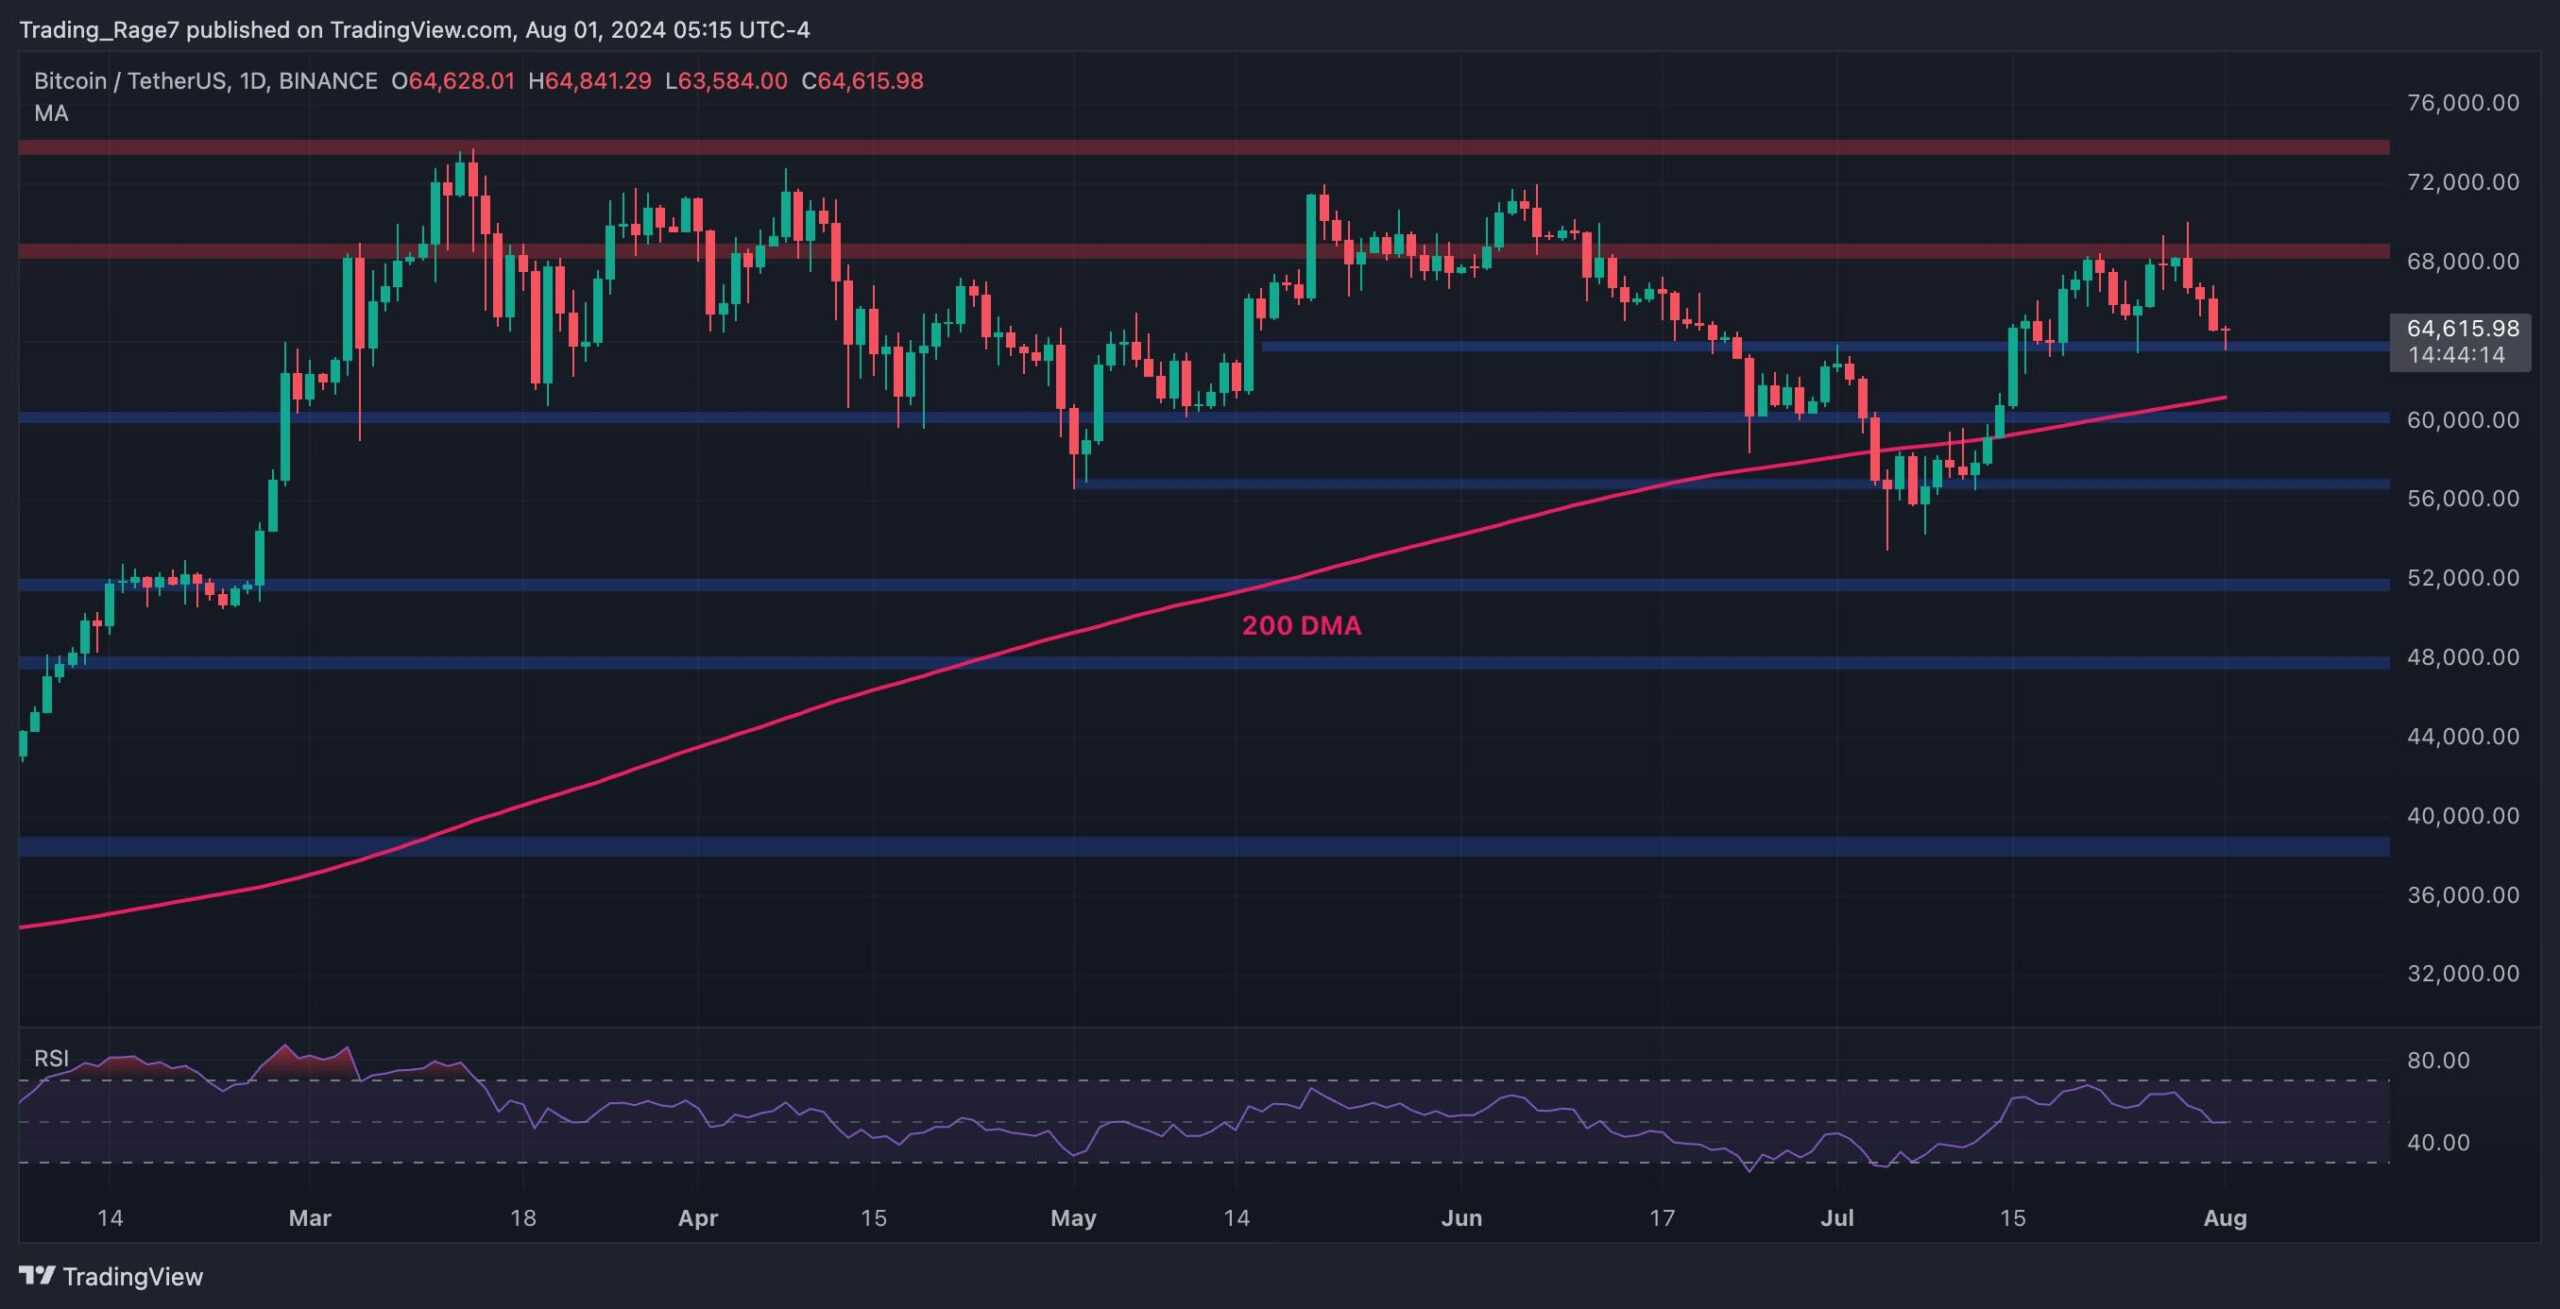
The Daily Chart
On the daily timeframe, the price has been moving rangebound between the $64K and $68K levels. The market has failed to break above the $68K resistance twice and is again testing the $64K support zone.
If the support level gets broken, the 200-day moving average, located around $61K, would be the next target for the bears. Still, as long as BTC trades above the 200-day moving average, the trend can be considered bullish.
Source: TradingView
The 4-Hour Chart
Looking at the 4-hour chart, the price shows a gradual decline in a falling wedge pattern. The cryptocurrency has found support at $64K and the lower boundary of the pattern.
If the market can break the falling wedge to the upside, BTC might be able to rally toward the $68K resistance level once again. Meanwhile, a breakdown of the $64K support is also possible, with the RSI showing bearish momentum.
Source: TradingView
On-Chain Analysis
By TradingRage
Bitcoin Exchange Netflow
While Bitcoin’s price is failing to continue its upward trend, analyzing the behavior of market participants would be beneficial. This chart presents the Bitcoin Exchange Netflow and its 30-day standard moving average. Positive values indicate deposits and negative values indicate withdrawals from exchanges on aggregate.
As the chart demonstrates, the BTC Exchange Netflows metric has recently seen two large negative days.
This indicates that investors use the current pullback to add more BTC to their portfolios. The 30-day moving average of exchange net flows has also been opposing over the last few months, pointing to the aggregate accumulation over this period. This behavior can result in a supply shock in the coming months, which could lead to a significantly rally.
Source: CryptoQuant
The post Bitcoin Price Analysis: BTC Dips Below $64K But Still Within Consolidation Range appeared first on CryptoPotato.
 Bitcoin
  Ethereum
  Tether
  BNB
BNB  Solana
  USDC
USDC  XRP
XRP  Dogecoin
  Toncoin
  Cardano
  Avalanche
  Shiba Inu
  Wrapped stETH
  Wrapped Bitcoin
  WETH
WETH  Bitcoin Cash
  Polkadot
  LEO Token
  NEAR Protocol
  Litecoin
  Sui
Sui  Aptos
Aptos  Bittensor
  Wrapped eETH
  Pepe
Pepe  Artificial Superintelligence Alliance
  POL (ex-MATIC)
  Stellar
  First Digital USD
  Ethena USDe
  OKB
OKB  Immutable
  dogwifhat
  Aave
Aave  Render
  Filecoin
  Optimism
  Hedera
  Arbitrum