Bitcoin’s price has been on the decline over the last couple of weeks, as it failed to create a new all-time high once again. However, the asset is now approaching a key support level.
Technical Analysis
By TradingRage
The Daily Chart
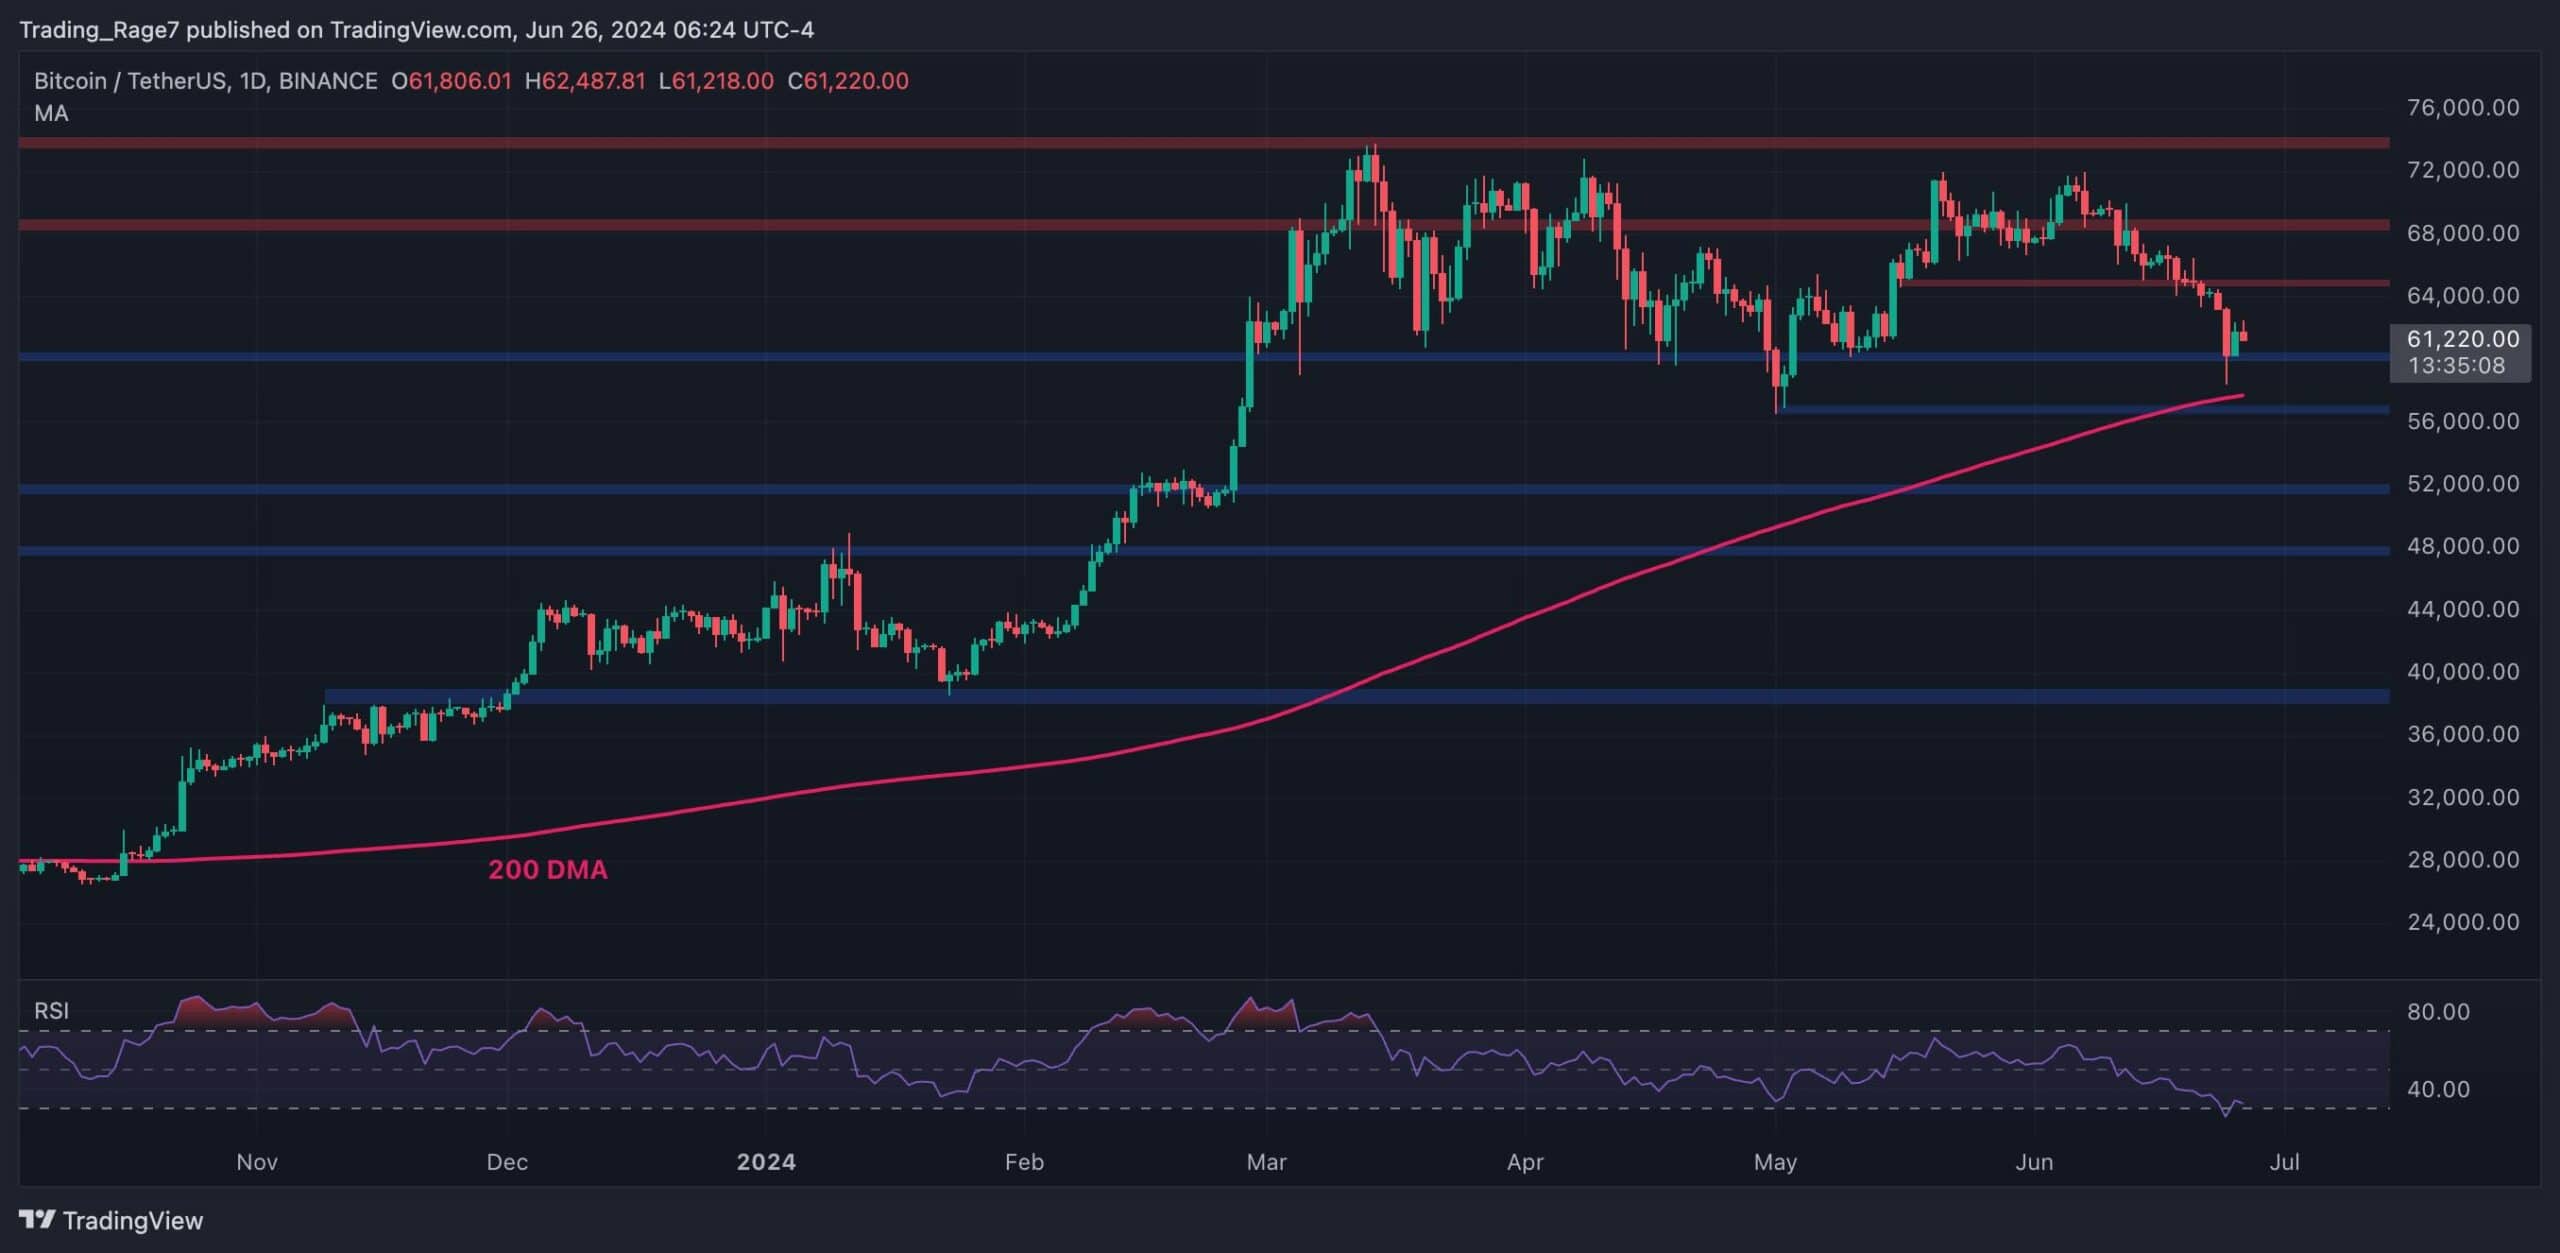
With the BTC price dropping fast, it is approaching the 200-day moving average on the daily timeframe. But first, for the asset to drop to that level, which is situated at around $57K, the $60K support level has to be broken decisively to the downside.
Meanwhile, the RSI is also reaching the oversold region, which could result in a bullish reversal soon.
The 4-Hour Chart
The 4-hour timeframe shows a more clear picture of the recent price action. The BTC price dropped below the $65K level a few days ago and quickly crashed under the $60K level before recovering above it.
This fake breakout below the $60K support zone has caused tons of long liquidations and could indicate that the asset would soon reverse higher. Yet, this heavily relies on whether the cryptocurrency can hold the $60K and $57K support levels.
On-Chain Analysis
By TradingRage
Bitcoin Long-Term Holder SOPR
With the price failing to continue above $70K once again, many investors are worried that BTC might be creating a local top. Looking at some of the fundamental metrics of the Bitcoin network, their concerns seem justified.
This chart presents the Bitcoin Long-Term Holder SOPR metric, which shows the profit realization ratio by investors who have held their coins for more than six months. It is evident that these holders are realizing profits at a rate higher than the $69K all-time high, even while the price has been trading lower than that level for the past few days.
One might assume that this profit realization behavior is natural for a bull market, but its magnitude can be a worrying sign. If this trend continues, the subsequent selling pressure could overwhelm the price, causing it to drop even lower and potentially end the bull market, at least for the mid-term.
The post BTC Recovers Above $61K But Danger Still Looms if it Breaks Below This Key Support Level: Bitcoin Price Analysis appeared first on CryptoPotato.
BTC Recovers Above $61K But Danger Still Looms if it Breaks Below This Key Support Level: Bitcoin Price Analysis
 Bitcoin
  Ethereum
  Tether
  BNB
BNB  Solana
  USDC
USDC  XRP
XRP  Dogecoin
  Toncoin
  Cardano
  Avalanche
  Shiba Inu
  Wrapped stETH
  Wrapped Bitcoin
  WETH
WETH  Bitcoin Cash
  Polkadot
  LEO Token
  NEAR Protocol
  Litecoin
  Sui
Sui  Aptos
Aptos  Bittensor
  Wrapped eETH
  Pepe
Pepe  Artificial Superintelligence Alliance
  POL (ex-MATIC)
  Stellar
  First Digital USD
  Ethena USDe
  OKB
OKB  Immutable
  dogwifhat
  Aave
Aave  Filecoin
  Render
  Optimism
  Hedera
  Arbitrum