Bitcoin’s price has recently experienced a decline following news of conflict in the Middle East. However, the market has seemingly found a footing.
Technical Analysis
By Edris Derakhshi (TradingRage)
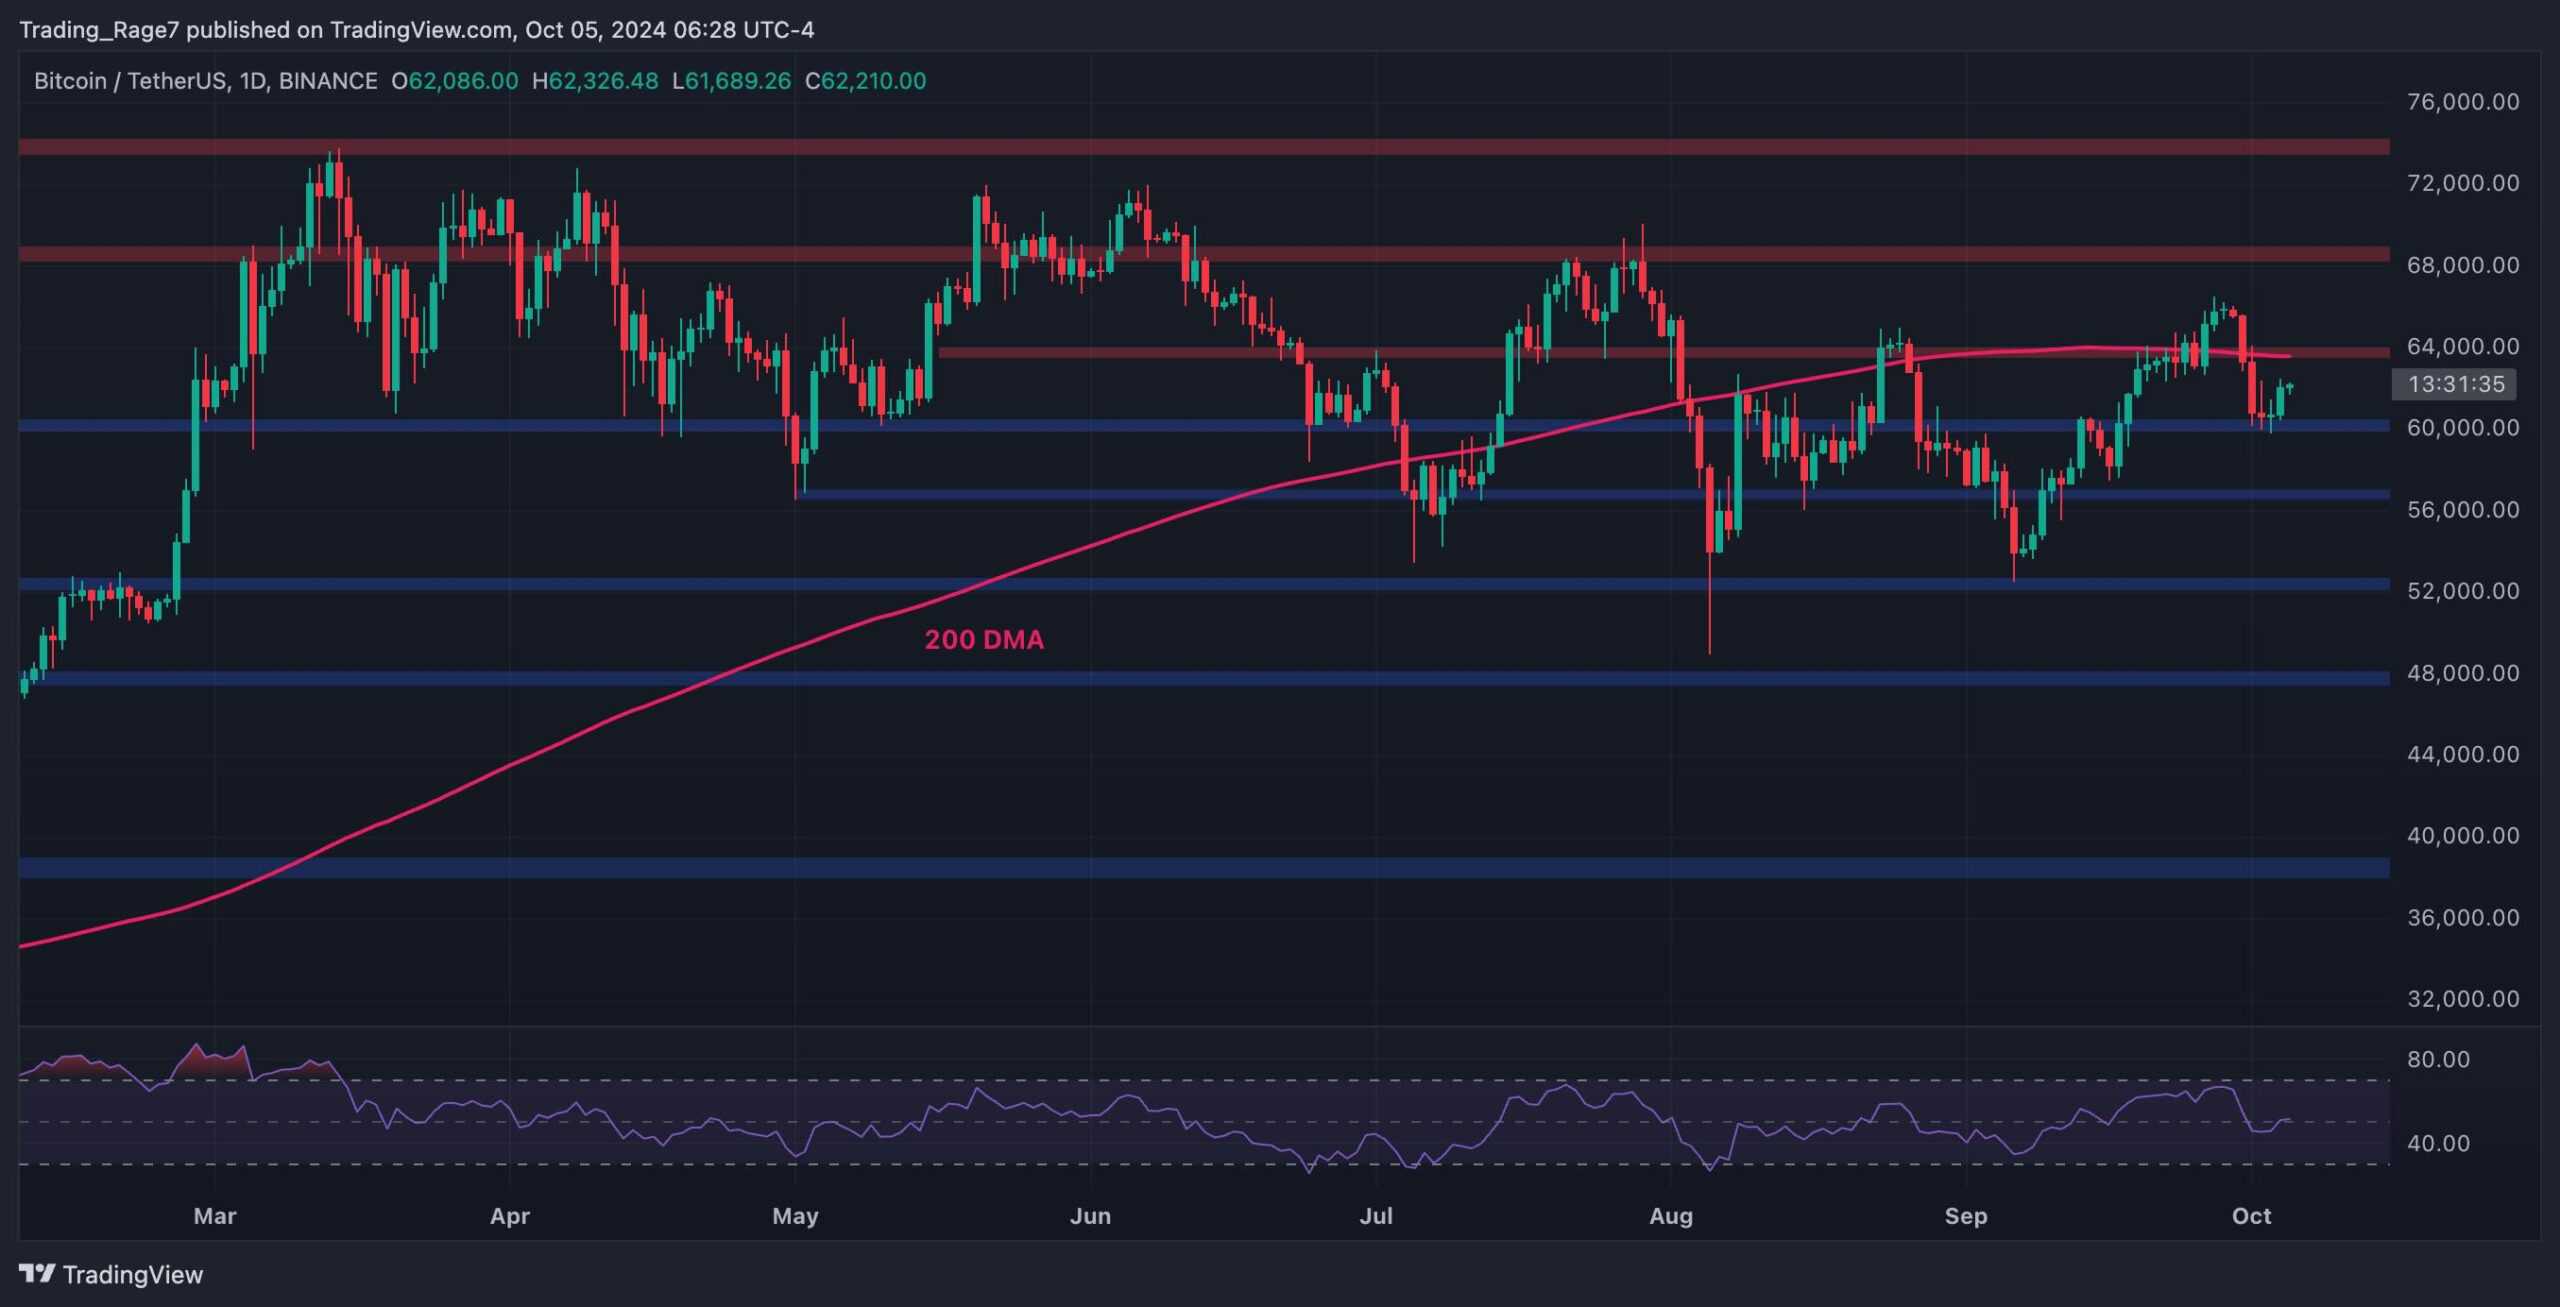
The Daily Chart
The daily chart shows that the price has recently broken below the $64K level and the 200-day moving average in the same area. However, the $60K support zone has seemingly held BTC, pushing it back higher toward the 200-day moving average.
If the market gets rejected from the 200 DMA, then a further drop toward the $56K level and even the $52K level would be probable.
Source: TradingView
The 4-Hour Chart
Looking at the 4-hour chart, it is evident that the market structure has gone through a bearish shift, with a breakout below the bullish trendline a few days ago.
However, the market has seemingly created a bottom at $60K, as the RSI was also showing an oversold state. Therefore, everything now depends on whether the price will be able to break above $64K or if it will be rejected and pushed further down.
Source: TradingView
On-Chain Analysis
By Edris Derakhshi (TradingRage)
Bitcoin Net Realized Profit and Loss (NRPL)
Bitcoin’s price has been consolidating for more than six months now, and market participants are still speculating whether the cycle top has formed or whether higher prices will be seen shortly. Analyzing the Bitcoin Net Realized Profit and Loss (NPRL) metric would be beneficial in this situation.
The metric measures the net profits or losses investors realize. Positive values are associated with net profits, and negative values show net losses.
As evident, while the market has not demonstrated a significant crash yet and has only been moving rangebound, the NRPL has already decreased to levels that were last seen when the price was around $30K, and the bull market was only beginning.
Therefore, if other factors do not drastically change, it could be concluded that BTC might be preparing for a new bullish run in the coming months.
Source: CryptoQuant
The post Is Bitcoin Gearing for a Major Move to $65,000? (BTC Price Analysis) appeared first on CryptoPotato.
 Bitcoin
  Ethereum
  Tether
  BNB
BNB  Solana
  USDC
USDC  XRP
XRP  Dogecoin
  Toncoin
  Cardano
  Avalanche
  Shiba Inu
  Wrapped stETH
  Wrapped Bitcoin
  WETH
WETH  Bitcoin Cash
  Polkadot
  LEO Token
  NEAR Protocol
  Litecoin
  Sui
Sui  Aptos
Aptos  Bittensor
  Wrapped eETH
  Pepe
Pepe  Artificial Superintelligence Alliance
  POL (ex-MATIC)
  Stellar
  First Digital USD
  Ethena USDe
  OKB
OKB  Immutable
  dogwifhat
  Aave
Aave  Filecoin
  Render
  Optimism
  Hedera
  Arbitrum