Although Ripple’s bullish momentum may have temporarily slowed down, recent price action hints that this might be about to change.
Nevertheless, it’s important to take a look at a few technical indicators to try and understand whether a correction is brewing or if XRP is on the verge of its next impulsive rally.
XRP Analysis
By Shayan
The Daily Chart
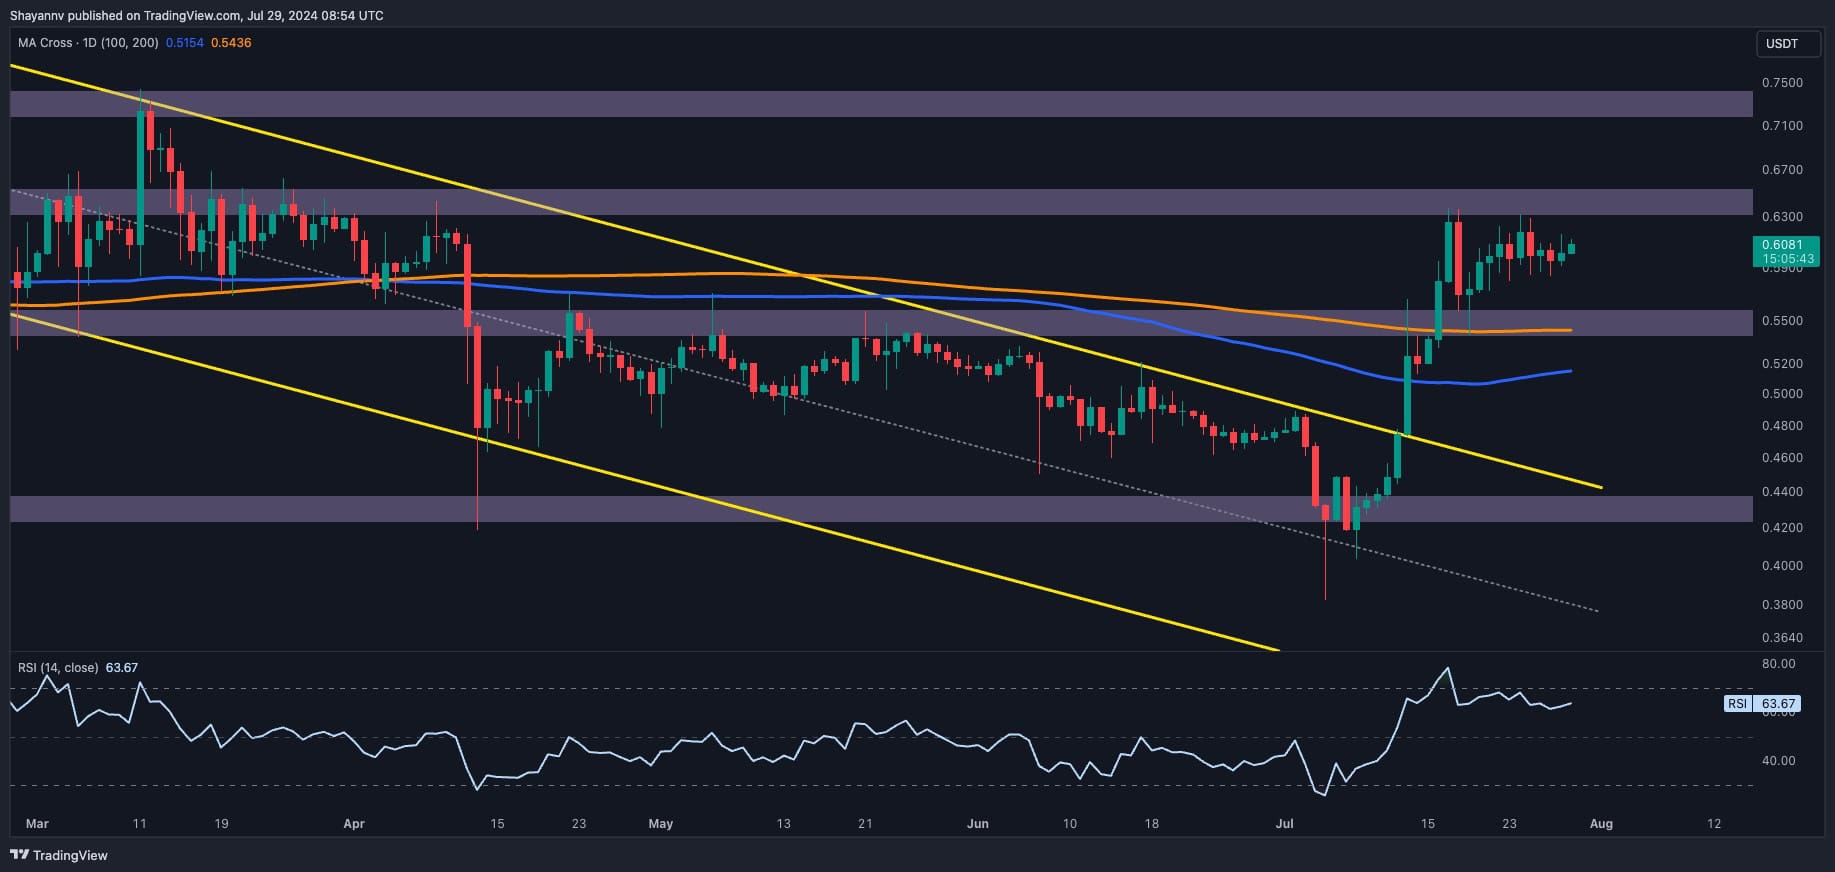
An in-depth examination of the daily chart reveals that after completing a pullback to the broken 200-day moving average at $0.54, Ripple found sufficient buying pressure, leading to a rally toward the critical $0.64 resistance. This crucial mark aligns with the price’s prior major swing high, serving as a significant barrier to buyers.
If the bulls manage to breach this pivot, continuing the positive trend toward the $0.7440 yearly high will become imminent, with Ripple buyers aiming to mark a new high.
However, considering the potential supply near this juncture and the slight bearish divergence between the price and the RSI indicator, a temporary corrective retracement stage is still on the table, with the price potentially consolidating within the $0.55-$0.64 significant range.
Source: TradingView
The 4-Hour Chart
Analyzing the 4-hour chart, it is evident that Ripple’s bullish momentum was met with notable selling pressure upon reaching the crucial $0.64 resistance region, leading to upward consolidation and forming an ascending wedge pattern.
The price is now at the narrowest range of the wedge pattern, with a breakout imminent.
Nevertheless, considering the bearish divergence between the price and the RSI indicator on the 4-hour timeframe and the potential supply near the $0.64 mark, a slight rejection followed by a short-term consolidation correction stage seems more plausible. If the price breaches the wedge’s lower boundary, a plummet toward the $0.55 threshold will be possible.
Yet, in the case of a more sustained corrective stage, the following potential targets for Ripple will be the 0.5 ($0.5) and 0.618 ($0.47) Fibonacci levels.
Source: TradingView
The post Ripple Price Analysis: Is XRP on the Verge of Exploding to $0.68? appeared first on CryptoPotato.
 Bitcoin
  Ethereum
  Tether
  BNB
BNB  Solana
  USDC
USDC  XRP
XRP  Dogecoin
  Toncoin
  Cardano
  Avalanche
  Shiba Inu
  Wrapped stETH
  Wrapped Bitcoin
  WETH
WETH  Bitcoin Cash
  Polkadot
  Sui
Sui  NEAR Protocol
  LEO Token
  Litecoin
  Bittensor
  Aptos
Aptos  Pepe
Pepe  Wrapped eETH
  Artificial Superintelligence Alliance
  POL (ex-MATIC)
  Stellar
  First Digital USD
  OKB
OKB  dogwifhat
  Ethena USDe
  Immutable
  Filecoin
  Aave
Aave  Optimism
  Render
  Arbitrum
  Hedera